B - Interface
- 17 Apr 2023
- 1 Minute to read
- Print
- DarkLight
- PDF
B - Interface
- Updated on 17 Apr 2023
- 1 Minute to read
- Print
- DarkLight
- PDF
Article Summary
Share feedback
Thanks for sharing your feedback!
a - Connection screen
Below is the Copilot login screen:
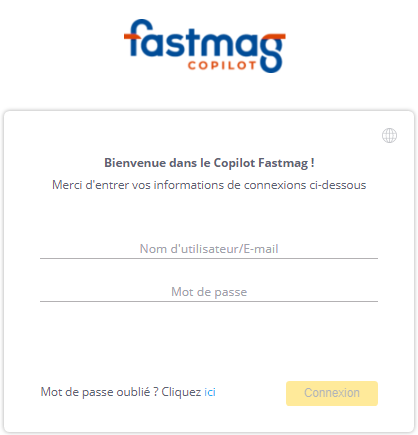
In Copilot, there are two types of licenses:
- The Viewer license, which allows you to view, explore, filter and export the dashboards at your disposal
- The Designer license, which, in addition to the same rights as the Viewer license, can also create, format, modify and share dashboards.
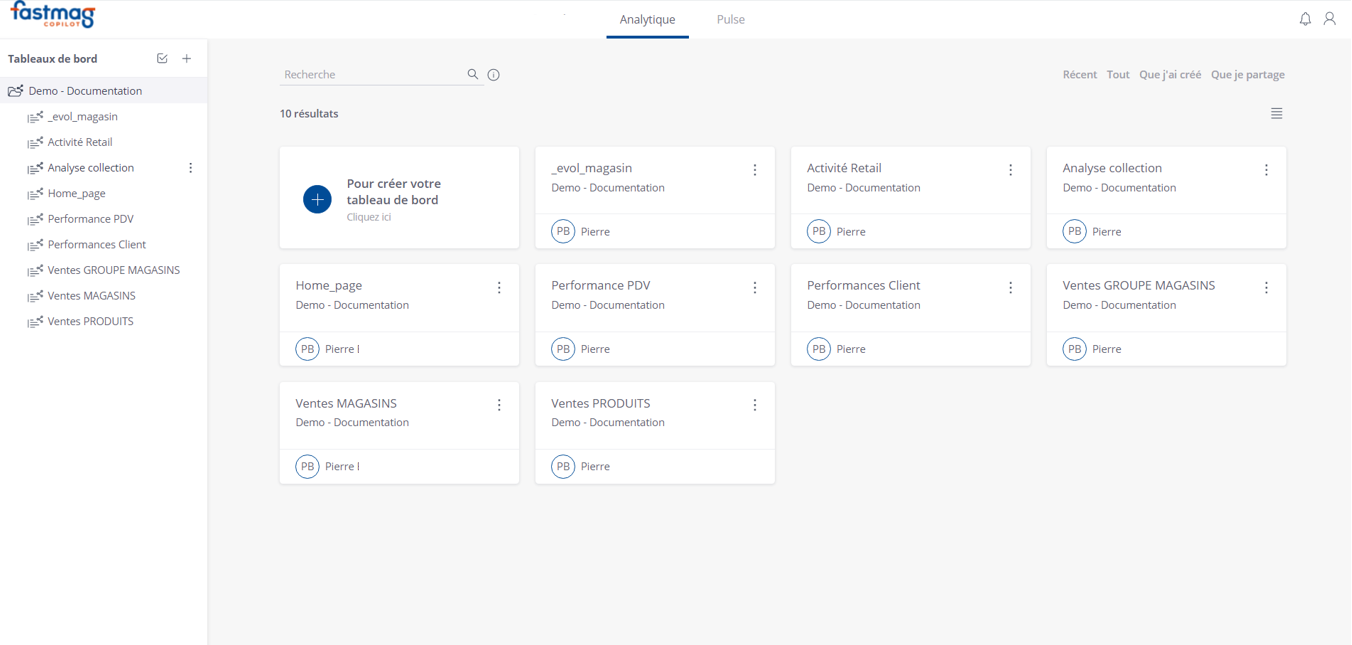
b - Dashboards
A dashboard is a group of "widgets" that allow you to visualize your data, and that you can also share with your team. It is possible to filter the dashboards thanks to the filters available to you, for example, by filtering on a date range, by filtering on a store, a product type, etc.
In Copilot, there are already prepared dashboards at your disposal, but it is also possible to create your own dashboards according to the user's license.
You can access your dashboards in two different ways:
- either through the analytical tab, in which you will see the most recently used dashboards, but you are also able to make more precise searches (top right: "Recent, all, I created, I share"), or through the search box (top left: "Search")
- or via the panel on the left which allows to list all the dashboards and the folders they are part of.
Below, the copilot interface, from a dashboard:
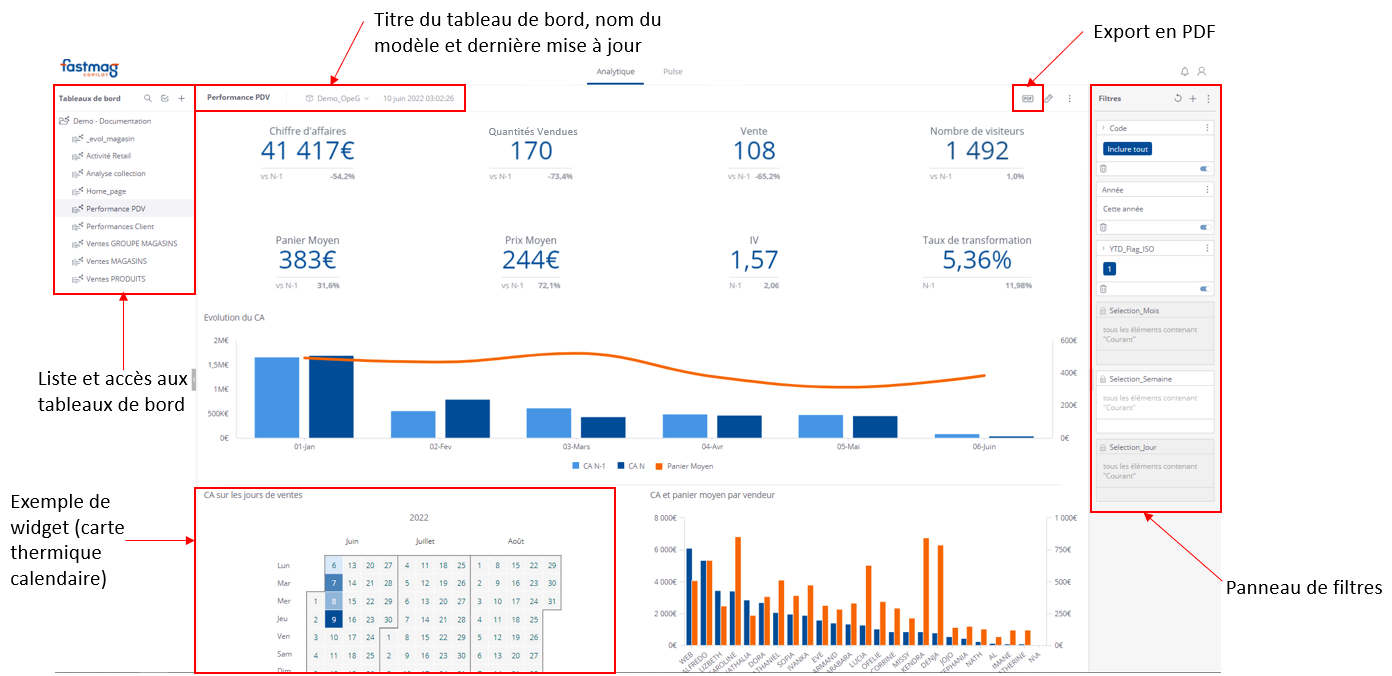
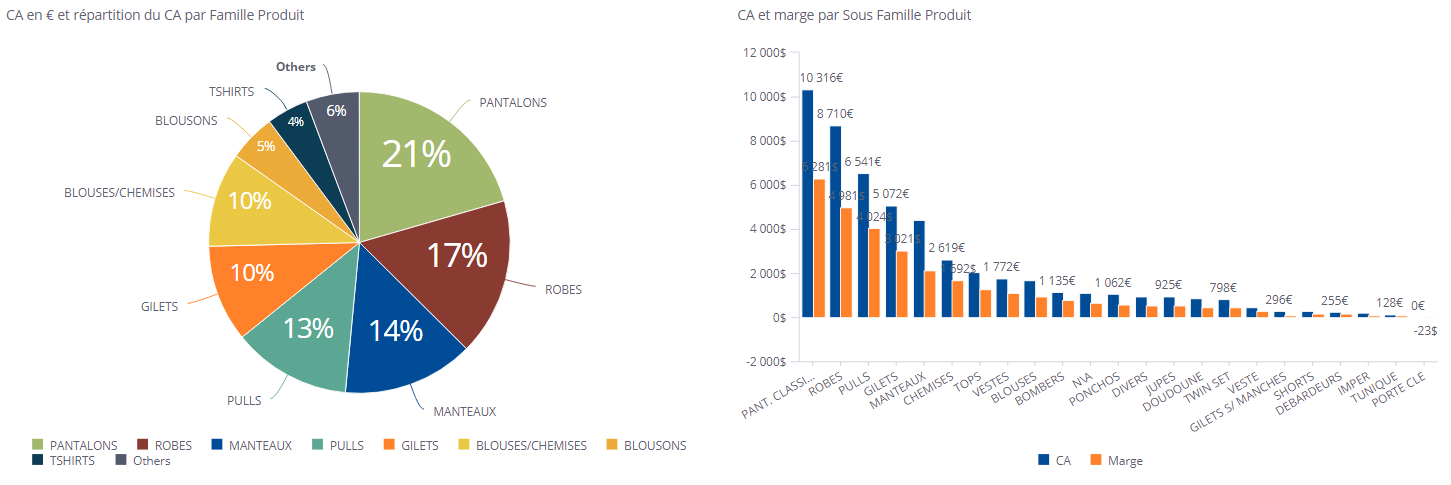
c - Widgets
Each widget is a dynamic representation of your data. They can be presented in several forms:
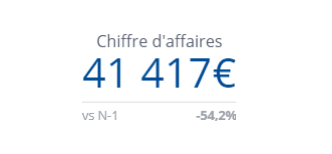
- Indicators,
- Curves,
- Areas,
- Bar charts,
- Circular diagrams,
- Ray diagrams,
- Point clouds,
- Polar graphs,
- Tables,
- Pivot tables,
- Heat maps,
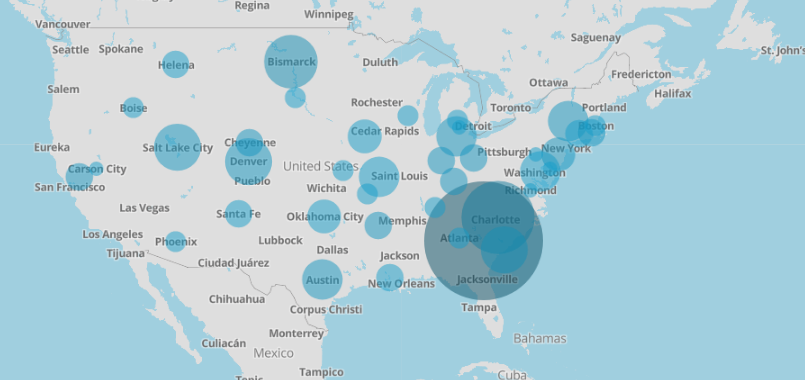
- Geographic maps,
- Moustache boxes,
- Proportional maps (tree map),
- Customized...
Was this article helpful?